Monday, October 14, 2013

Long Term Market Outlook

Long Term Market Outlook

as per my developed modal daily and monthly chart confirming breakout while weekly chart has not given breakout.

when i club the Elliott Wave counts with this modal,i need more confirmation.

In terms of Elliott Waves prospective market need to cross all time high ,by crossing all time high means larger degree wave 2 end with contracting triangle.

i will update all the charts Daily-Weekly-Monthly for your reference.

so lets wait and watch market crosses all time high or not till then just watch it.

if market not able to cross all time high then bowties diametric is still valid and sensex will fall to 15000.


i always write We all must move along the simple idea that all forecasts are an imagination of the future disciplined by observations of the past and as new evidences presents itself on the table be humble to adjust our anticipations accordingly.

if market crosses all time high then i expect USD INR 5th wave will be terminal and we may have long bull market for INR towards 53-48 levels.

I don’t know whether you and I should expect such low levels but the Elliott Wave Principle suggests it and till the market proves it wrong it might be better to be prepared for the above scenario till a better one is clearly emerging.

This is only for education and information Purpose; please consult your financial adviser before trading or investing in stock market.

Thanks And Regards

Nishesh Jani.

Professional Trader & Investor.
www.zerodelta.in

Wednesday, September 18, 2013

SENSEX-C of Flat A-B-C or Contracting Triangle over?

SENSEX-C of Flat A-B-C or Contracting Triangle over?

i have updated 4 different possibilities of sensex wave formation on 11 November 2012

first was FLAT a-b-c

second was contracting triangle

3rd and 4th diametric and bowtie diametric

if market cross all time high which is 21210 then i am seeing long term bull market and in that post i have updated sensex target 39000 and now it may even go higher towards 50000

if market not able to cross all time high then bowties diametric is still valid and sensex will fall to 15000.

i always write We all must move along the simple idea that all forecasts are an imagination of the future disciplined by observations of the past and as new evidences presents itself on the table be humble to adjust our anticipations accordingly.

if market crosses all time high then i expect USD INR 5th wave will be terminal and we may have long bull market for INR towards 53-48 levels.

I don't know whether you and I should expect such low levels but the Elliott Wave Principle suggests it and till the market proves it wrong it might be better to be prepared for the above scenario till a better one is clearly emerging.

This is only for education and information Purpose; please consult your financial adviser before trading or investing in stock market.

Thanks And Regards
Nishesh Jani.

Professional Trader & Investor.


www.zerodelta.in

Tuesday, September 10, 2013

SENSEX- Distribution zone 20355 to 20450

SENSEX- Distribution zone 20355 to 20450

This is the major area before this or between this area sensex will see large distribution and again bears will control the market.

there is simple technique of Higher tops and higher bottom and lower top and lower bottom sensex has already start making lower top and lower bottom .

apart from this green channel is for buy and red channel is for sell which works well on both side and currently there is SELL in this signal

as a professional trader i can only say exit in this rally and wait weather market makes higher top-higher bottom-crossing green channel and invalidation of head and shoulder then we have to re think about the next move.

We all must move along the simple idea that all forecasts are an imagination of the future disciplined by observations of the past and as new evidences presents itself on the table be humble to adjust our anticipations accordingly.

I don't know whether you and I should expect such low levels but the Charting Principle suggests it and till the market proves it wrong it might be better to be prepared for the above scenario till a better one is clearly emerging.

This is only for education and Information only,please consult your financial adviser Before Trading and investments in market.

Thanks And Regards

Nishesh jani

Professional Trader & Investor

www.zerodelta.in

Friday, August 23, 2013

USE Rally to Exit The Market ,have eye on 1885 point head and shoulder target 16700-16600

USE Rally to Exit The Market ,have eye on 1885 point head and shoulder target 16700-16600

i had updated nifty weekly chart before few week ago with possible triangle and head and shoulder with target 4800 and now updating sensex daily chart with head and shoulder pattern.

i have updated daily chart with labels of head and shoulders which is worth of 1885 points and in times to come i expect sensex to fall towards 16700-16600 kind of levels.

after such a volatile past 6 trading sessions and oversold momentum indicators we can expect some sort of consolidations and some more recovery towards 61.8% retracements as drawn on charts which is around 18800

along with this next week is the FnO expiry so we may see stock particular momentum and expect next week could be be consolidation come some sort of corrective rally towards 18800 above that distribution will be aggressive by bears .(19400 in any expected recovery which is not preferable counts )

i am expecting more bed quarterly results by the sensex/nifty and over all many companies because majority of them had not expected this kind of Rise in USD-INR and they have not hedge their positions and expect more bed results by booking forex losses and in the September month expect 16700-16600 kind of levels or it may take 100% time taken by triangle which is 89 days then expect we may see this levels by end of December month.

but over all my point is on higher levels i will not run and buy but will exit and will go for FIXED DEPOSIT 


We all must move along the simple idea that all forecasts are an imagination of the future disciplined by observations of the past and as new evidences presents itself on the table be humble to adjust our anticipations accordingly.

I don’t know whether you and I should expect such low levels but the Elliott Waves Principle suggests it and till the market proves it wrong it might be better to be prepared for the above scenario till a better one is clearly emerging.

This is only for education and Information only,please consult your financial adviseror Before Trading and investments in market.

Thanks And Regards

Nishesh jani

Professional Trader & Investor

www.zerodelta.in

Blog-www.janibrotehrs.blogspot.in

Tuesday, August 13, 2013

10 Trades of clients with full Details (Profit INR 154400)

10 Trades of clients with full Details (Profit INR 154400)

Good Morning To All

As i mention day before yesterday that i will update the full trade details,below is the details 

Profit Trade Details (229900)

Sail Fu sell at 50 Book Profit at 40 (10*4000)=40000
hpcl fu sell at 240 book profit at 195 (45*1000)=45000
HDIL fu sell at 38.75 book profit at 31 (7.75*4000)=31000
DLF fu sell at 175 book profit at 131.50 (43.50*1000)=43500
JP ASSO fu sell at 51 book profit at 33.40 (17.6*4000)=70400

Loss Trade Details (75500)

Bharat Forge sell at 193 book loss at 204 (11*1000)=11000
BOI fu sell at 167 book loss at 175 (8*1000)=8000
HCL TECH fu buy at 958 book loss at 910 (48*500)=24000
LUPIN fu buy at 909 book loss at 864 (45*500)=22500
Jain Irrigation fu sell at 48.25 book loss at 50.75 (2.5*4000)=10000

NET PROFIT=154400

Have look at inside the trades.

(1) 50% success ratio

(2) one trade profit covers 93.25% of total loss (total loss 75500 while jp asso profit 70400)

(3) Not a single trade loss is greater than single trade profit

(4) Average profit per trade is 30800 ,while average loss per trade is just half at 15100

(5) Average profit per trade is double then average loss per trade

(6) The lowest profit trade is even higher then highest loss trade (lowest profit trade HDIL 31000 while highest loss trade HCL 24000)

you may be wonder how this happen ? but this is the style of professional traders they simple do two things

(1) Cut Loosing trades as soon as they hit their stop loss
(2) They hold the winners untill there is technical reason to exit the trade.

one of the common mistake always made by the traders is

FAILURE TO CUT LOSSES-pride and ego prevents traders from exiting loss making trades

At below points traders should do nothing

when you are confused and dont know what to do,do nothing
There are no set ups in your watch list,then dont trade
You are trend trader and there is no trend to trade,dont trade
if you are not at your best mentally and emotionally then dont trade until you are.

in my next update probably tomorrow (Independence day) i will send article on

What a trader can control

What a Trader can not control

Earn Money in any kind of market, Rising or Falling or sideways By going Long & Short

Ideas will be mine but patience -discipline -Implementation - Earnings will be yours

Every day spend just few minutes to put stop loss in the system after trade and rest of the day do your work,no need to sit and watch TV /read news papers/rumors/

To make profit one needs to trade right stock at right time,a novel i was reading AAKHET by ashwinee bhatt in which one of character says his works is to be at the right place at right time the same way traders need right stock and trade at right time.

This is only for information and educational purpose,please consult your financial adviser before trading or investing in market.

To get more information you can call on 09227065762
To contact me on E-Mail -nisheshjani@gmail.com
Web-www.zerodelta.in
Blog-www.janibrothers.blogspot.in

Thanks And Regards

Nishesh Jani.

Professional Trader & Investor

Monday, August 12, 2013

INFOSYS-Qualifies As Buy In Quantitative Strategies Portfolio.

INFOSYS-Qualifies As Buy In Quantitative Strategies Portfolio.

By Combining The two factors

Valuations

Price Momentum

Stock qualifies as buying as per the Strategy.

In this strategy which is used by HNIs,Investors,Hedge Funds,Institutions (FII/Mutual Funds) across the world ,we select the stock as per the Fundamentals and once stock qualifies as buy based on fundamentals we use price momentum to see weather the stock has demand supply mismatch? if there is more demand then supply then we select as a buy with in built TRAIL STOP LOSS as we dont know how much the stock can move higher.

And we believe what William O Neil says

"What Seems too high and risky to the majority usually goes higher and what seems low and cheep usually goes lower."

I have selected this stock as buy in my wealth management portfolio for clients.

This is only for your information and educational purpose,please consult your financial adviser before trading or investing in market.

as a professional investor i or my family may have investments in the stock.

Thanks And Regards

Nishesh Jani.

Professional Trader & Investor.

www.zerodelta.in

Blog www.janibrothers.blogspot.in

E-mail nisheshjani@gmail.com

Customer Care-09227065762

50% Success Ratio But Profit Above 150000 !


we are about to close all short position ,our last open position open is sell
J P ASSO with trail stop loss 33.40 short given below 51.
with just 50% success we will close with big profit,a detailed report will be published after closing out all position with entry and exit levels and along with more detailed analysis of the trading rules.
so stay tuned with me on FB /web www.zerodelta.in/ . Blog www.janibrothers.blogspot.in/ .E-mail nisheshjani@gmail.com

Customer Care-09227065762
Thanks And Regards
Nishesh Jani.
Professional Trader & Investor.
www.zerodelta.in
Tuesday, August 6, 2013

SENSEX -NIFTY weightage creating problem!

SENSEX -NIFTY weightage creating problem!

if i labeled the sensex triangle then C leg greater then A 

if i labeled the nifty triangle then D greater then B 

will the EXPANDING TRIANGLE WILL be inplace? if this is the case then sensex should go beyound 18467 and E leg Beyound 20300 !

or simply labeled as 5 wave decline! wave 1 6229 or 6133 to 5566 and 5566 to 6094 wave 2 and with head and shoulder wave 3rd start? and significantly change in USD INR wave on upside ! lets see who market behave in next few days and then will take decision

in this kind of structure stock particular are generating less whipsaw signal and generating good return.

We all must move along the simple idea that all forecasts are an imagination of the future disciplined by observations of the past and as new evidences presents itself on the table be humble to adjust our anticipations accordingly.

I don't know whether you and I should expect such low levels but the Elliott Waves Principle suggests it and till the market proves it wrong it might be better to be prepared for the above scenario till a better one is clearly emerging.

This is only for education and Information only,please consult your financial adviseror Before Trading and investments in market.

Thanks And Regards

Nishesh jani

Professional Trader & Investor

www.zerodelta.in

Monday, August 5, 2013

USD INR-B leg extending but Distribution may start soon

USD INR-B leg extending but Distribution may start soon

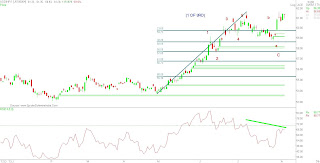
i have updated daily chart of USD INR

and labeled wave pattern and this is the 1st of 3rd and currently B of 1st is extending and along with this there is negative divergences on RSI

in times to come USD INR to see distribution and completion of Extending wave B and then expect wave C on down side towards 58.58-57.65 and then again wave 3rd of 3rd will start which will be very powerful and market will have Bath of BLOOD.

all in all i am seeing topping out formation for USD-INR and appreciation of INR .

We all must move along the simple idea that all forecasts are an imagination of the future disciplined by observations of the past and as new evidences presents itself on the table be humble to adjust our anticipations accordingly.

I don't know whether you and I should expect such low levels but the Elliott Waves Principle suggests it and till the market proves it wrong it might be better to be prepared for the above scenario till a better one is clearly emerging.

This is only for education and Information only,please consult your financial adviseror Before Trading and investments in market.

Thanks And Regards

Nishesh jani

Professional Trader & Investor

www.zerodelta.in

NIFTY-last leg of Sell of-Bottom Soon-Accumulation zone Start

NIFTY-last leg of Sell of-Bottom Soon-Accumulation zone Start 

i have updated weekly chart of the nifty

i have labeled two formation

Head and shoulder (Green colored)

Triangle (Blue Colored)

There are two possible triangles

BARRIER TRIANGLE formation= D leg maximum can retrace up to B leg which is 5566 and E in upside to start

CONTRACTING TRIANGLE formation = D leg should complete before reaching towards B leg means bottom before 5566 and E in upside to start

in above both cases i am seeing accumulation zone up to 5566 and then rally in form of TRIANGLE leg E towards 6094 maximum and then pattern will breakdown into down side along with clear head and shoulder pattern.

will update when what will be the action after the pattern when it will require ,currently i am focusing on accumulation and end of D and start of E leg

We all must move along the simple idea that all forecasts are an imagination of the future disciplined by observations of the past and as new evidences presents itself on the table be humble to adjust our anticipations accordingly.

I don't know whether you and I should expect such low levels but the Charting Principle suggests it and till the market proves it wrong it might be better to be prepared for the above scenario till a better one is clearly emerging.

This is only for education and Information only,please consult your financial adviseror Before Trading and investments in market.

Thanks And Regards

Nishesh jani

Professional Trader & Investor

www.zerodelta.in

Saturday, August 3, 2013

Bracket Theory Setting Un-Believable Targets !

Bracket Theory Setting Un-Believable Targets !

in past i have given un believable lower target for stocks and now again i have selected 12 stocks with bracket theory targets 

ANDHRA BANK
CMP 60 TARGET 11

BHARAT FORGE
CMP 197 TGT 125-34

GAIL
CMP 305 TGT 45

JP ASSO
CMP 30 TGT 15

NMDC
CMP 99 TGT 42

JSW STEEL
CMP 500 TGT 343

PETRONET LNG
CMP 117 TGT 46

SESA GOA
CMP 127 TGT 19

STERLITE
CMP 75 TGT 33

TATA STEEL
CMP 202 TGT 62

RELIANCE IND
CMP 850 TGT 398

LT
CMP 845 TGT 587

We all must move along the simple idea that all forecasts are an imagination of the future disciplined by observations of the past and as new evidences presents itself on the table be humble to adjust our anticipations accordingly.

I don't know whether you and I should expect such low levels but the Bracket Theory Principle suggests it and till the market proves it wrong it might be better to be prepared for the above scenario till a better one is clearly emerging.

This is only for education and Information only,please consult your financial adviseror Before Trading and investments in market.

Thanks And Regards

Nishesh jani

Professional Trader & Investor

www.zerodelta.in

Thursday, August 1, 2013

My Key Points While Investing based on Value Investing Method

My Key Points While Investing based on Value Investing Method

Quality of the Business and Growth Prospectus

High Entry Barriers with Predictable Profits

Avoid Start Up and Technological Breakthrough Companies

Choose single/focused business companies

No Investments in commodities/cyclical nature Companies

Zero or less Government/Political interference

High Return On capital Employed

Invest in low capital intensity business

Good Cash flow that enable future expansion and dividend payouts

Zero Debt (or batter use of debt if any)

Invest when available at ridicules or throwaway Price compare to intrinsic value of the business

Management should be honest and competent with transparent policies and batter accounting practices.

There may be many other points which may help while investing and as and when I will find will update on my list, by reading above factors you may think I am bit more conservative, yes I am because investing is like owning a business and if I was business person then would have find business which clears above criteria and I believe in slow and steady wins the race like turtles.

Over a period of time I have understand that it is batter to trade High Growth Companies via Trend Following methods so when investing in High growth companies or companies doesn’t pass the above criteria I trade based on trend following or based on other technical analysis theory .

If you like the article or have any suggestions or any query do reply me.

This is only for information and educational and information purpose, please consult your financial adviser before trading or investing.

Thanks and Regards

Nishesh Jani.

Professional Trader & Investor.

www.zerodelta.in

New Web Site and Contact Details

Hello everyone

I Nishesh Jani-Pofessional Trader & Investor has started new web site

www.zerodelta.in

my E-mail Id is nisheshjani@gmail.com

Customer Care number is 09227065762

Thanks And Regards

Nishesh Jani

Tuesday, September 18, 2007

best of luck for stock market game

friends we are engage in stock market for many years and family experience we will provide you best stock idea with our theory which is rarely used in market,SPECULATION IS THE ANALYUZING THE DATA AND TAKING POSITION ON THE VARIOUS MARKET SITUATION TO PROFIT FROM THE FAVOURABLE PRICE MOVEMENT